6.1. Overview
The Opal Dashboard is a Web-based graphical user interface that allows to monitor an Opal service, to view statistics regarding its usage and to execute deployed applications from within a standard Web browser. The dashboard is automatically deployed in the same Web application along with Opal, and it can be accessed at http://servername:8080/opal2/dashboard.
The Opal dashboard provides the following tabs:
Home: This provides general information about Opal, and an overview of the rest of the functionality of the Dashboard.
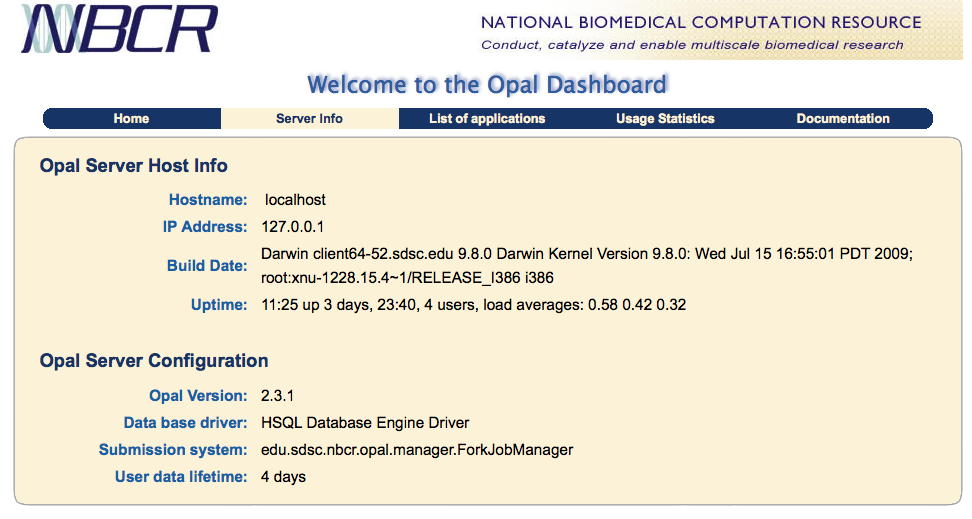
Server Info: This provides general information about the Opal installation, such as server configuration, versions, etc.
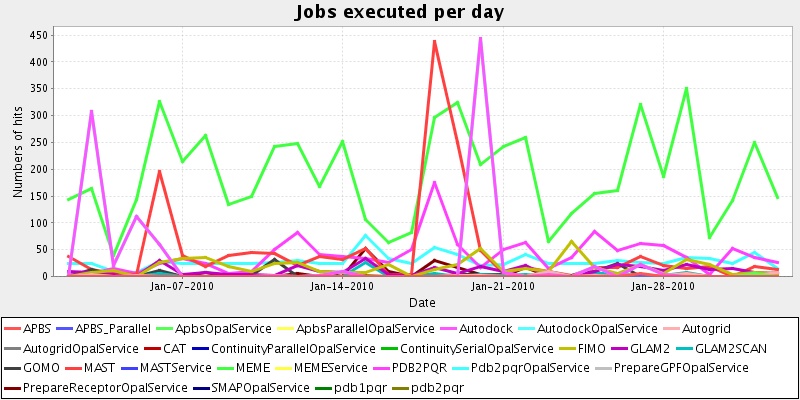
Usage Statistics: This provides charts with usage statistics, errors and average execution times. The charts are created dynamically based on user inputs, such as a time range and particular services of interest. If a database other than HSQL DB is used, the charts will only include services that are currently active. In other words, services that have been undeployed will not be displayed. If HSQL DB is used, then all services that have ever been deployed will be displayed.
The following screenshot displays the number of jobs executed per day over a specified timeframe. Users can select a time window, as well the services that they would like to be plotted.
List of Applications: This provides a list of all the installed applications. Users can search for applications based on specified metadata, and click on the applications to access submission forms. An Atom feed for the list of applications is also available.
Documentation: This provides relevant information about Opal such as documentation, websites, tutorials, publications, etc.
The list of installed applications is generated dynamically by fetching real time data from the Apache Axis engine. When the user clicks on one of the available services, the Opal dashboard displays one of two types of submission forms depending on the configuration of the specific application: